
The number of homes available for sale is measured not only by the number but also by time. Understanding how housing inventory is calculated will help you determine the supply and demand in a real estate market.
Knowing this can make you a smarter home buyer — and seller.
What is housing inventory, and how is it measured?
Housing inventory is calculated by the number of homes currently listed for sale in a particular market, then expressed as the number of months it would take to sell all of those homes. The result is known as the “months of supply.”
How to calculate housing inventory:
Total active listings / average monthly sales = Months of supply
An example:
In April 2026, there were 1.47 million existing homes listed in the U.S. With an average number of monthly sales of 335,000, there was a housing inventory with a 4.4-month supply:
1,470,000 / 335,000 = 4.388
This monthly measure of housing supply is often applied separately to existing homes and new construction. In April, the new residential home supply was 9.4 months, according to the U.S. Census Bureau and the Department of Housing and Urban Development.
What ‘months of supply’ means
To better understand the housing ‘months of supply,’ inventory is ranked by whether a market is most suited to buyers, sellers, or is “balanced.”
-
A five- to six-month supply represents a balanced market.
-
Less than five months indicates a lack of inventory, creating a seller’s market. Home prices may rise, and buyers have fewer choices.
-
More than six months of inventory indicates a buyer’s market because there are ample homes to choose from, sales are taking longer, and prices may become more competitive.
Why is housing inventory so low?
In an analysis published late last year, JP Morgan Private Bank listed several factors creating the lack of national housing inventory we currently face:
-
About half of current homeowners have mortgage interest rates under 4% — and 80% have home loans under 6%. These borrowers are resisting taking on a higher loan rate to move.
-
A backlog of new construction followed the 2008 financial crisis. JP Morgan estimates it will take nearly 10 years to resolve the shortage.
-
The cost of owning a home today is roughly 40% higher than renting, and hopeful homebuyers need years to save up for a down payment.
Housing inventory is most needed for middle-income earners
A lack of homes that middle-income households can afford is also an issue.
“Too much of the inventory available today remains concentrated at higher price points, leaving a shortage of options for entry-level and middle-income buyers,” said Nadia Evangelou, National Association of REALTORS’ principal economist, in a recent analysis.
NAR research found that households earning about $75,000 per year can afford only about one-quarter of current home listings nationwide. In a balanced market, they might be able to afford about 44% of listings. That would require 300,000 more homes priced at or below $261,000, the report added.
Current mortgage rates and housing inventory
Higher mortgage rates have also contributed to the lack of housing inventory. Many would-be home buyers remain on the sidelines.
Affordability is one reason why, JPMorgan reported. Before the pandemic, the median-priced home was about $260,000, and interest rates were below 4%, allowing for a monthly payment of around $1,000.
Now, the median-priced home is over $400,000, and rates are above 6% — the result: a monthly payment of more than $2,100.
Housing inventory where you live
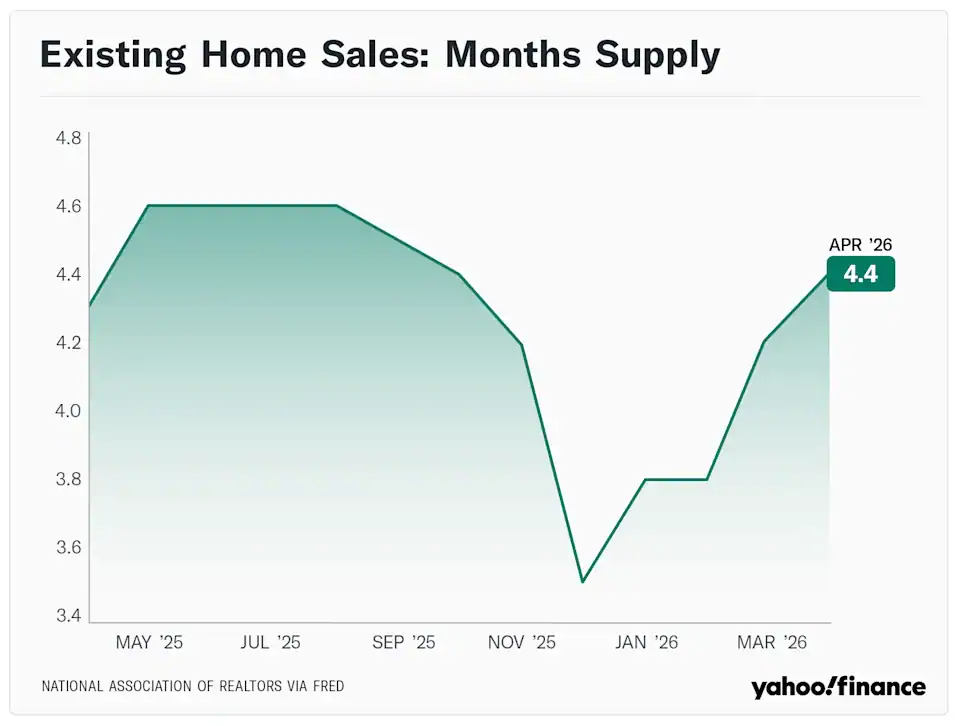
As we mentioned, the April monthly supply of existing homes was 4.4 months, and you can see the trend in the chart below. More homes are being listed for sale since the beginning of the year.

While national trends may be interesting, what’s important to know is the supply of homes where you are looking to buy.
The American Enterprise Institute, a right-of-center nonprofit think tank, publishes a quarterly housing market report on 100 of the largest housing markets. The analysis provides the months’ supply for each market, as well as home price appreciation, median home sale prices, and other valuable information.