

DOW JONES TECHNICAL FORECAST
OUTLOOK: NEUTRAL
US equities had a rough week as rising Treasury yields pressured investors to consider other alternatives to the Dow Jones, Nasdaq 100 and S&P 500. The sudden changes on the fundamental side have spurred key technical divergences across the US indices visible on their respective price charts. The Dow Jones has come out better than its counterparts as it looks to enjoy a confluence of support slightly beneath the Friday close.
DOW JONES PRICE CHART: DAILY TIME FRAME (JANUARY 2020 – FEBRUARY 2021)
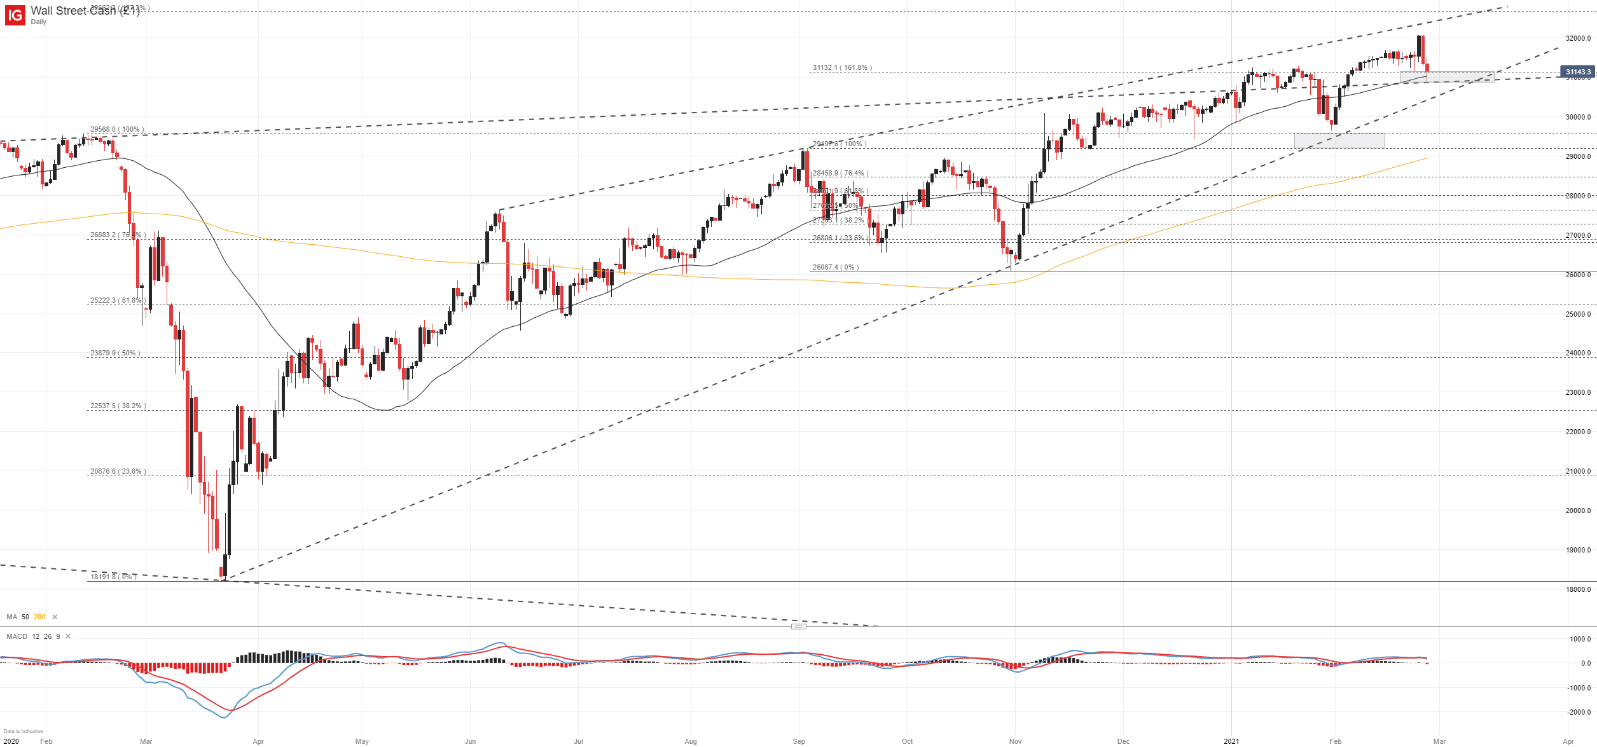
To that end, the Dow Jones will look to the rising trendline from January 2018 which bounces off the high in February 2020 followed by a nearby Fibbonaci level, the 50 day moving average and a rising trend line from March 2020. Together the technical levels should provide considerable support to the industrial average as it looks to avoid a deeper retracement. Should the Dow Jones break beneath the March trendline, further losses might be in store as it would constitute a serious technical break.
NASDAQ 100 TECHNICAL FORECAST
OUTLOOK: BEARISH
Elsewhere, the Nasdaq 100 has already posted a serious technical break.Falling beneath the rising trendline from the March and November lows, the Nasdaq 100 effectively opened the door lower last week and further losses could be in store as a result of this key breakdown. While the fundamental side is currently unfolding, the damage has been dealt to the technical landscape and because of that damage, there may be ongoing weakness for the tech heavy index.
NASDAQ 100 PRICE CHART: 4 – HOUR TIME FRAME (SEPTEMBER 2020 – FEBRUARY 2021)
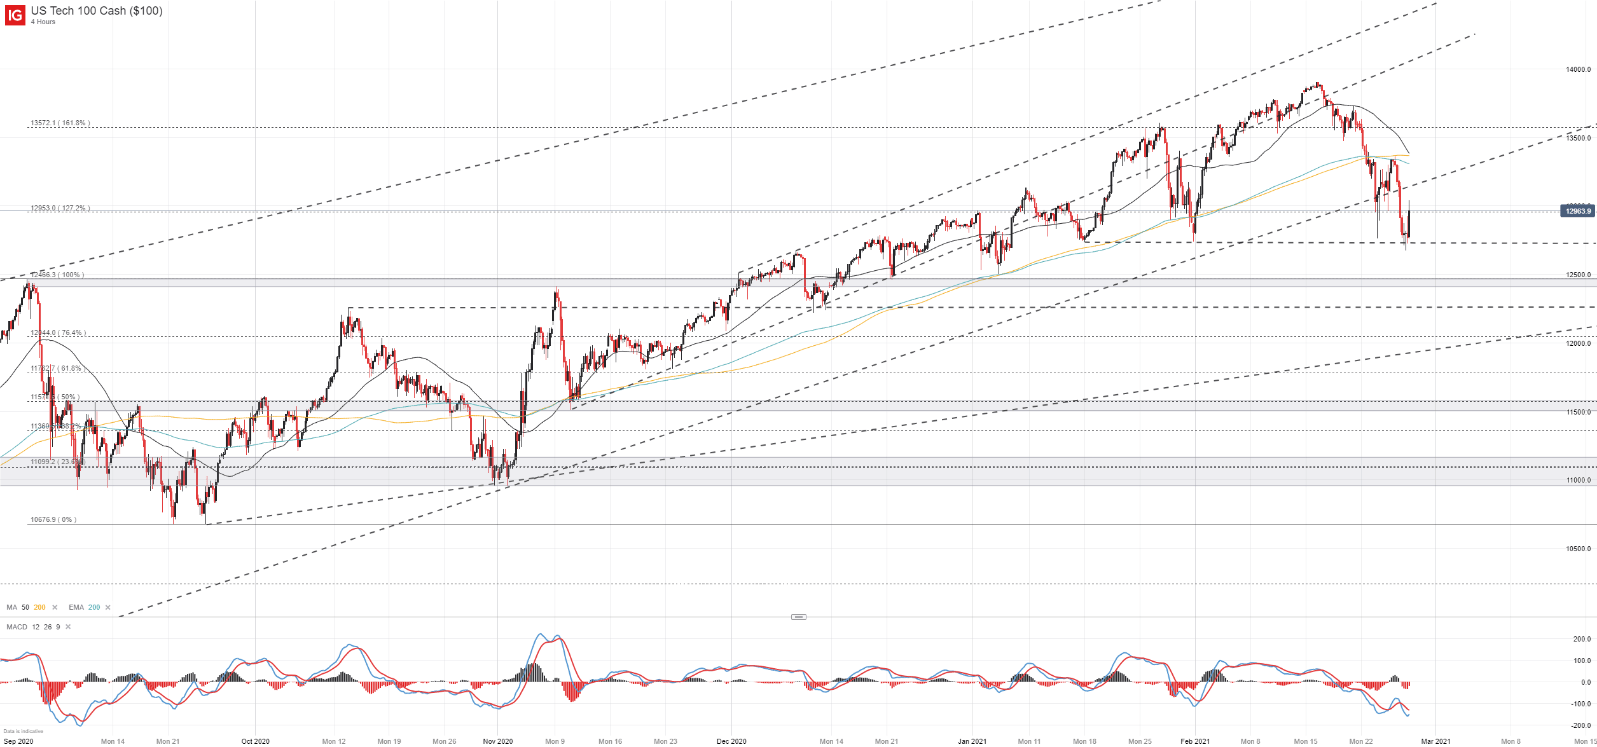
After dominating US equity price action for months as tech stocks dragged the other sectors higher the Nasdaq now appears to be in a position of vulnerability and support may be initially derived from the January swing low around 12,738. Subsequent assistance might be found along the September high just beneath 12,500. In the meantime, follow @PeterHanksFXon Twitter for updates and analysis.
S&P 500 TECHNICAL FORECAST
OUTLOOK: NEUTRAL
Unsurprisingly, the S&P 500 has split the difference between the industrial-leaning Dow Jones and the tech-heavy Nasdaq 100 and crucially trades above the March uptrend. Generally viewed as the best barometer of US equities, the S&P 500 will be the index to watch in the week ahead as a break beneath the March trendline could signal broader equity weakness is on the horizon.
S&P 500 PRICE CHART: DAILY TIME FRAME (JANUARY 2020 – FEBRUARY 2021)
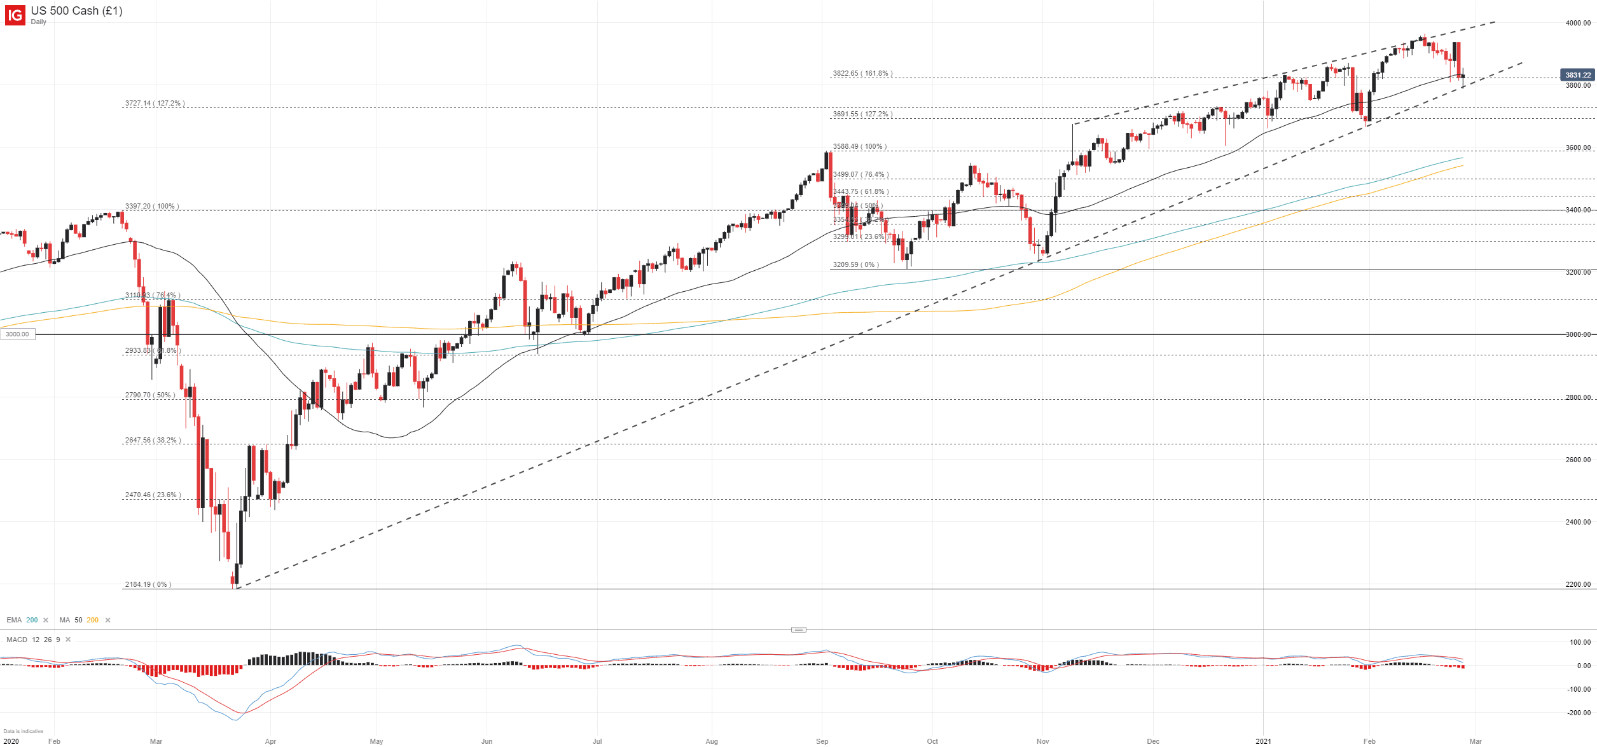
If, on the other hand, the S&P 500 can stave off a break lower, broader equities might continue to tread water even if the Nasdaq 100 were to slowly bleed lower. Either way, the Dow Jones, Nasdaq 100 and S&P 500 are approaching an inflection point and it looks as though strategies that favor Nasdaq weakness and Dow Jones strength might be well suited for the current climate.