

After a boost on Tuesday, following the release of U.S. inflation data, bitcoin prices were once again lower on Wednesday. BTC has mainly traded below $40,000 during the session, with ETH continuing to hover above the $3,000 level.
Bitcoin
Following a slight rebound in price during yesterday’s session, BTC fell below $40,000 earlier today, and has remained there throughout the day so far.
BTC/USD dropped to an intraday low of $39,389.66 on Wednesday, which came less than 24 hours after hitting a peak of $40,617.59.
Wednesday’s move saw prices move past the support level of $39,515. However, they have since rallied, moving away from these lows.
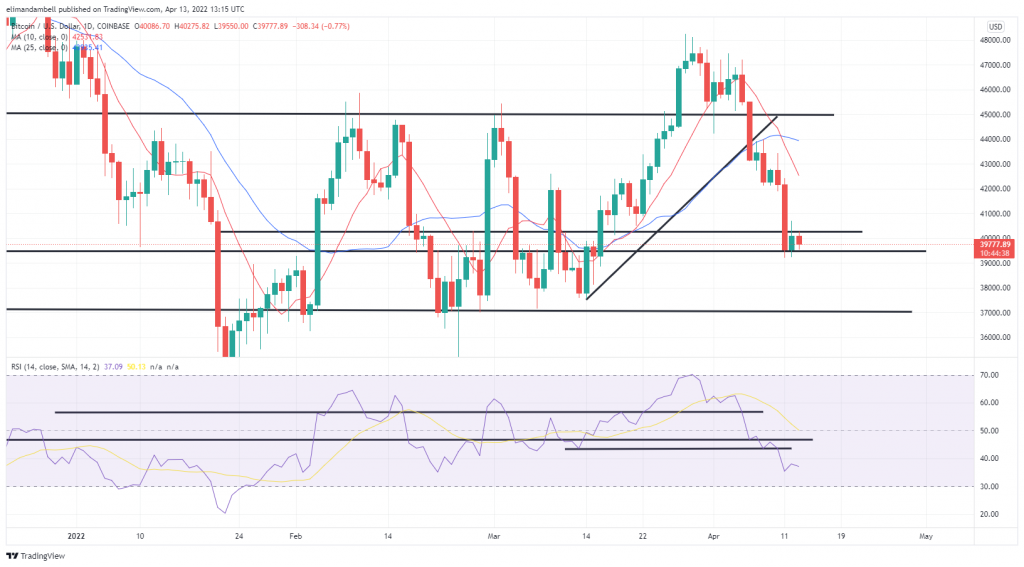
As of writing, BTC is now trading at $39,783.91, which is still 1.66% lower than yesterday’s high, with some expecting further declines.
Prominent Twitter technical analyst “Plan B” ran a poll asking his 1.7 million followers if they believed BTC will dip below $30,000, to which 45% of those who voted said “yes.”
The majority who voted “no” are likely looking at the RSI, which is currently tracking at 37, and is already oversold, and may be anticipating a more short-term realistic target of $37,000.
Ethereum
ETH was fighting to stay above $3,000 on Wednesday, as its price was also marginally lower than that of yesterday’s peak.
On Wednesday, ETH/USD fell to an intraday low of $3,005 following the earlier high of $3,080, which sees the price down 2.10% as of writing.
Despite this drop, bulls seem to still be unmoved by the uncertainty of prices, and could even look to send ETH back towards resistance.

However, looking at the chart, a cross of the 10-day and 25-day moving averages has occurred, which could be a sign that momentum may indeed be bearish.