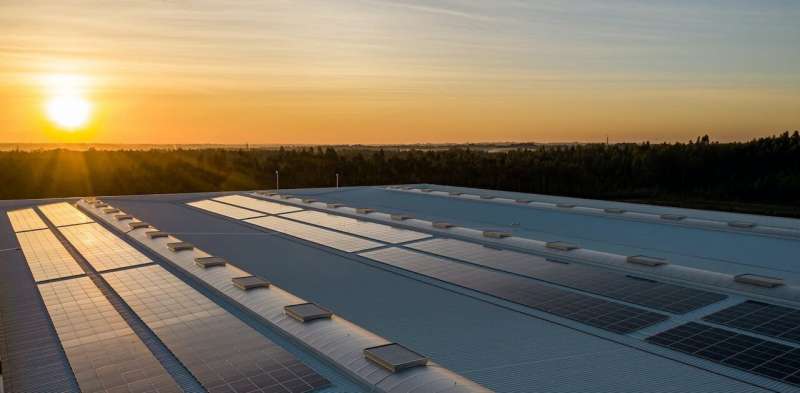
Almost one in three Australian households have solar panels on their roofs. Most are motivated by rising electricity prices and environmental concerns.
Households are paid a so-called feed-in tariff for surplus energy they export to the grid. While customers would love to get paid for every bit of energy they’re able to export to the wider grid, operators have imposed a fixed or “static” limit on how much energy each household can export. This helps keep network voltages—or electric pressure—within a safe range.
The limits are needed because of uncertainty about the impacts on the network of fluctuations in households’ energy use and exports.
The network is connected to households via “low voltage” transformers that reduce the voltage to a level customers can use. The uncertainty arises because operators can see what’s happening at each transformer, but not what’s happening in each household.
We are working on a data-monitoring project to enable network operators to see household voltage and current data in real time. The idea is to enable them to manage network voltage fluctuations more precisely.
This could allow households to safely export more solar, depending on local network conditions. People would arguably receive more money while speeding up the transition to zero-emissions electricity by providing more renewable energy to the network.
Managing a tricky transition
The electricity network was originally set up for “bulk” generation from centralized power stations. The flow was in one direction from coal, gas or hydroelectric stations to energy users, including households.
However, economic forces and aging systems mean many of these power stations are being rapidly retired. They’re being replaced, in part, by so-called “distributed energy resources.” These resources include rooftop solar, household or community batteries, and electric vehicles.
The household export limit to the network is usually around 5 kilowatts (kW), regardless of time of day or what households are generating or consuming. But, because of the falling cost of solar, 10kW residential systems (capable of producing twice the export limit) are increasingly common.
The Australian grid operator, AEMO, envisages distributed solar generation will make up 69GW of network capacity by 2050, compared to around 21GW now.
Integrating this energy generation is a big challenge for the energy market, transmission and distribution network operators.
The Australian Standard for household voltage has “allowable” and “preferred” operating zones around 230 volts. Keeping the voltage within these zones is better for energy efficiency and appliance life.
But when energy flow is “two-way” and unpredictable, both to and from houses, it becomes more challenging to keep the voltage within these zones. When lights flicker or appliances are damaged, that’s a sign the voltage is outside these safe limits.
How much household data do operators need?
If the operators could see household voltage and current data in real time, they might be able to set “dynamic” limits on households for the import and export of energy. That means limits are allowed to fluctuate depending on local network conditions, instead of being static. Households might then be able export more energy overall than they do now.
A long-term project of the Australian Renewable Energy Agency, Project SHIELD, aims to answer a key question here. That is, how much data do operators need to allow this flexibility, while still safely co-ordinating energy flows to and from the grid?
The project involves The University of Queensland, network operators and the private sector. A project partner, Luceo Energy (an offshoot of a company that formerly employed one of the authors), working with Energex, Ergon and Essential Energy, has rolled out 20,000 devices in households across Queensland that collect their energy data at one-minute intervals.
Smart meters installed in Victoria typically record energy data every 30 minutes. The new devices measure multiple electricity parameters, such as voltage and current, every minute.
This creates extraordinary amounts of data, which can be used in electricity studies and simulations. It also creates storage and analysis challenges.
The data collected are used to answer “what if?” questions. If an operator had perfect knowledge of conditions at every house attached to a transformer, they could create a safe dynamic limit. But would it still be safe if they could see the data for only 50%, or even 20%, of houses?
World-first simulation systems developed by Queensland company GridQube enable the operators to answer such questions. Data collected by the devices provide a key input.
Several representative locations and time periods have been chosen to see how network visibility can affect the envelope. The local network is simulated using a “power flow” with different network parameters, such as voltage. Then the key questions around safe limits can be answered.
Benefits for both consumers and operators
Of course, this is only one level of the electricity network. We still need to build considerable amounts of high-voltage transmission to integrate increasing distributed energy resources. This will help provide a reliable and secure power supply.
The data generated by Project SHIELD will inform electricity modelers and data scientists about what is happening at the household level (both electricity usage and solar generation). It can improve forecasting and modeling as data on this scale have not been previously available.
As the roll-out of devices and gathering of data continue at speed, operators can start to relax the limits on household solar energy exports. Greater visibility of local networks offers clear benefits for both consumers and operators.

