WEDNESDAY’S WALL STREET TRADING SESSION RECAP
The Dow Jones, Nasdaq Composite and S&P 500 sank 1.99%, 2.14% and 2.67% respectively on Wednesday. This followed a much higher-than-expected US CPI report. In April, headline consumer prices accelerated 4.2% y/y versus 3.6% anticipated. That was the fastest pace of growth since 2008. The core rate, excluding energy and food costs, clocked in at 3.0% y/y versus 2.3% anticipated.
This also follows last week’s non-farm payrolls report, where average hourly earnings beat expectations while job gains and the unemployment rate materially disappointed estimates. Since the end of last week, odds of a rate hike from the Federal Reserve by the end of next year have been on the rise again, climbing by about 35%. Unsurprisingly, this is fueling risk aversion in financial markets.
Rising monetary policy tapering bets are driving up Treasury yields, making returns on relatively safer assets more competitive. Reports also crossed the wires that CDC advisers backed the use of Pfizer’s Covid vaccine in adolescents. That could speed up the rate of inoculations, opening the door to a faster-than-expected economic recovery.
DOW JONES TECHNICAL ANALYSIS
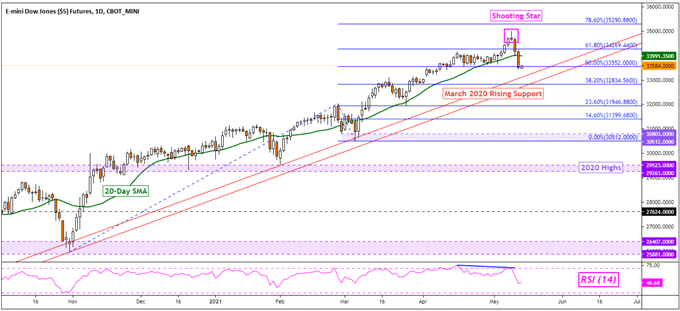
Dow Jones futures closed under the 20-day Simple Moving Averaged (SMA), opening the door to testing rising support from last year’s bottom. This also followed the emergence of a Shooting Star candlestick pattern, hinting that a turn lower was in store as retail trader positioning became increasingly net-long. All eyes are on the rising trendline from 2020, which may reinstate the dominant upside focus.
DOW JONES FUTURES – DAILY CHART
NASDAQ 100 TECHNICAL ANALYSIS
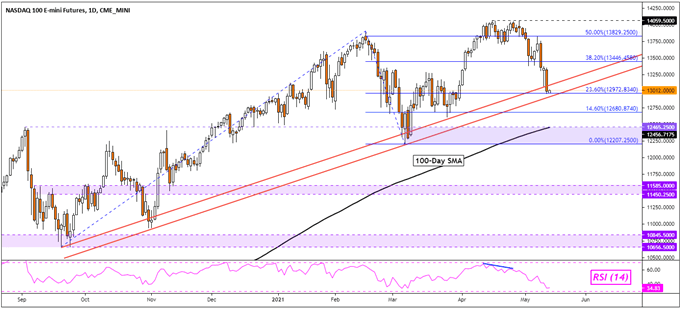
The turn lower in equities has brought Nasdaq 100 futures on the cusp of rising support from September. Prices are also eyeing the 23.6% Fibonacci extension at 12972. Support could reinstate the dominant upside focus. Having said that, a drop under the trendline would expose the 100-day SMA. Subsequently taking out the latter could open the door to testing lows from March.
NASDAQ 100 FUTURES – DAILY CHART
THURSDAY’S ASIA PACIFIC TRADING SESSION
With that in mind, Thursday’s Asia Pacific trading session could be rough if the pessimistic sentiment from the previous day continues. The Nikkei 225 opened about 0.9% to the downside, with Australia’s ASX 200 also aiming lower. Futures indicate that Hong Kong’s Hang Send Index is down about 1%. Taiwan’s semiconductor-heavy index also risks extending recent aggressive losses. Emerging Market indices could be particularly vulnerable odds of Fed tapering given foreign debt repayment woes.
NIKKEI 225 TECHNICAL ANALYSIS
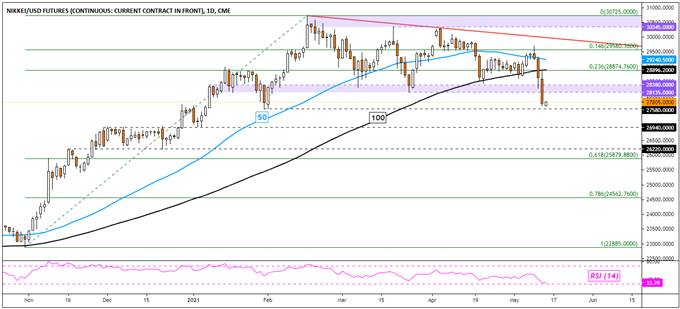
The Nikkei 225 index could be readying to confirm a close under the key 28135 – 28380 inflection zone. That would expose the late January low at 27580. This also followed a push under the 50-day and 100-day SMAs. A bearish crossover may soon occur, hinting at broader weakness ahead. Closing under the late January low would expose the 26940 inflection point.
NIKKEI 225 FUTURES – DAILY CHART
ASX 200 TECHNICAL ANALYSIS
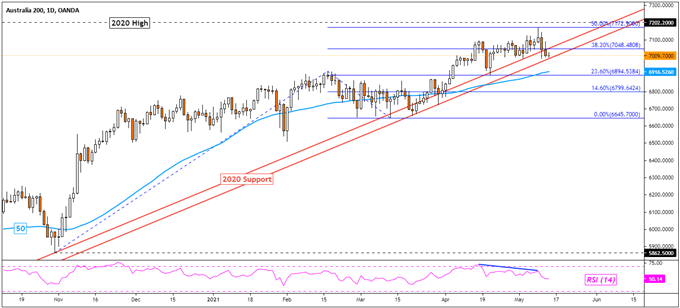
The ASX 200 is pressuring rising support from 2020, which may maintain the dominant upside focus. The recent turn lower followed negative RSI divergence, showing that momentum was fading and hinting at a turn lower. Further losses from here exposes the 50-day SMA, which could act as key support. Resuming the uptrend would place the focus on the 2020 high.
ASX 200 – DAILY CHART
