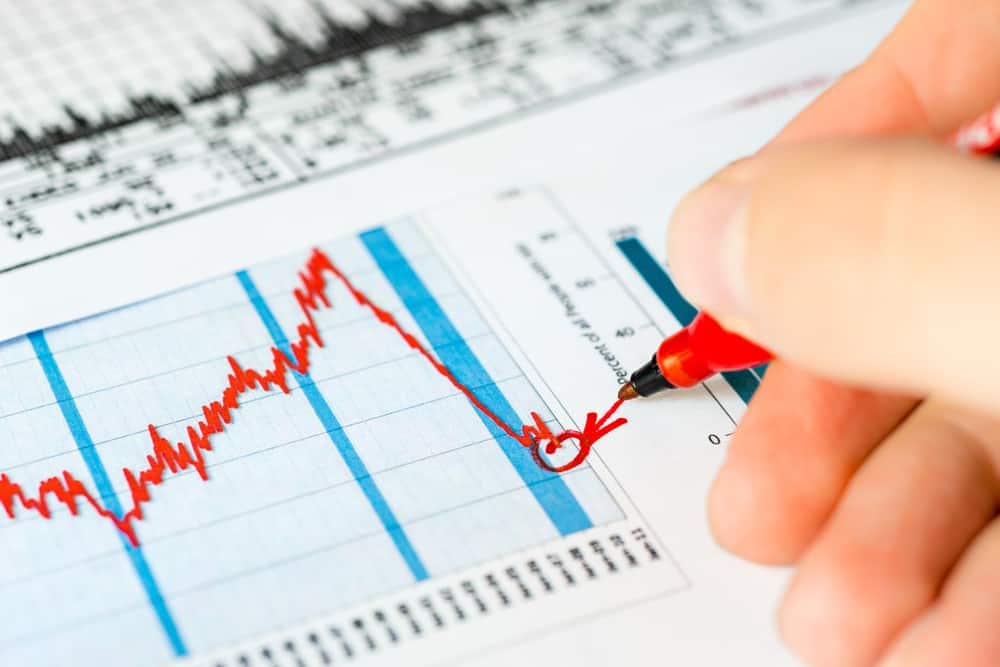
This year has exposed investors to some of the wildest volatility on record. The unprecedented uncertainty created by the coronavirus pandemic caused the benchmark S&P 500 (SNPINDEX:^GSPC) to lose 34% of its value in only 33 calendar days. For context, it’s taken an average of 11 months for previous bear markets to reach a decline of at least 30%.
In addition to one of the most brutal stock market crashes in history, investors also witnessed a ferocious rally from the March 23 low. It took less than five months for the S&P 500 to hit a new all-time high from the bear market low, which is also a record.
With COVID-19 far from gone and the U.S. about to enter the heart of flu season, the question has been raised if this roller coaster ride could continue. History would certainly seem to suggest that additional volatility, with even another stock market crash, is possible.
But should another stock market crash or correction occur, there are three extremely important statistics you’ll want to keep in mind.
1. Stock market corrections happen, on average, every 1.84 years
One of the most important things to realize about stock market crashes and corrections is that they’re extremely common. I know it might feel like the investing powers that be are specifically trying to smite you and your nest egg at times, but pullbacks in equity valuations are the price of admission to the greatest wealth creator on the planet.
Since 1950, the S&P 500 has undergone 38 official stock market corrections — official in the sense that the decline reached an unrounded 10% from a recent closing high. This works out to a correction of at least 10%, on average, every 1.84 years. Of these 38 corrections, nine have been official bear market declines of at least 20%. A bear market occurs every 7.78 years, on average.
As much as we’d like the stock market to just keep heading higher, the economic cycle involves natural peaks and troughs. These troughs are what have a tendency to send equity valuations lower.
But it’s not just the economy that causes the stock market to vacillate. While operating earnings drive long-term movements in equities, the short term is often dominated by news events and investor emotions. Emotional trading has a way of overshooting to both the upside and downside, which is why stock market corrections and crashes can be so violent at times.
2. The average stock market crash/correction lasts about six months
Secondly, it’s important for investors to really understand how long stock market crashes and corrections last. The fact is, a majority of corrections/crashes are measured in months, whereas bull markets are almost always measured in years.
Of the 38 stock market corrections that have occurred in the S&P 500 since the beginning of 1950, they’ve lasted:
- 13 days to 104 days: 24 total corrections/crashes.
- 157 days to 288 days: 7 total corrections/crashes.
- 422 days to 929 days: 7 total corrections/crashes.
Nearly 2 out of 3 corrections (63%) over the past 70 years have run their course and found a bottom in 3.5 months or less. Another 18% of all corrections/crashes have resolved between the five-month and 10-month mark. Put another way, better than 4 in 5 stock market corrections/crashes have historically hit bottom in 10 months or less. Compare this with the fact that we just finished up an 11-year bull-market rally.
What’s more, there’s been a discernible drop in correction length since roughly the mid to late 1980s. As computers have become mainstream, it’s become easier to disseminate information to Wall Street and retail investors. With rumors less likely to rule the roost, 13 of the 16 corrections since 1985 have lasted 104 days or fewer.
Overall, the average correction since 1950 has lasted 188.6 days (around six months), with corrections since 1985 lasting only 155.4 days (about five months).
3. Long-term investors are batting 1.000
Maybe the most important stock market crash statistic of all is this: Each and every official correction in the history of the S&P 500 has eventually been erased by a bull market rally.
Frankly, there are a lot of things we don’t know about stock market corrections and crashes. We’re never going to know ahead of time:
- When a correction/crash will begin.
- How long it’s going to last.
- How steep the decline will be.
What we do know is that, in every single instance throughout history, a correction or bear market has eventually (key word!) been erased by a bull market rally. Sometimes this occurs in a matter of a few weeks or months, whereas other times it can take years to completely recoup losses. The point is, if your investing time frame is measured in years, no correction or crash is really a concern. In fact, by this definition, every single crash or correction is a huge buying opportunity for long-term investors.
Historically, the average annual return of the stock market is around 7%, including all of these crashes and corrections. This means that typical long-term investors can expect to double their money about once a decade.

