The prevailing mood in the markets right now is neither bullish nor bearish but rather befuddled.
For investors, trying to gauge sentiment among other investors and traders is a constant undertaking, a way to sort out what bets are popular, which themes are played out and where lies the index direction that would cause the greatest surprise.
Collecting all the readings together leads to a sense that the consensus is experiencing more confusion than conviction.
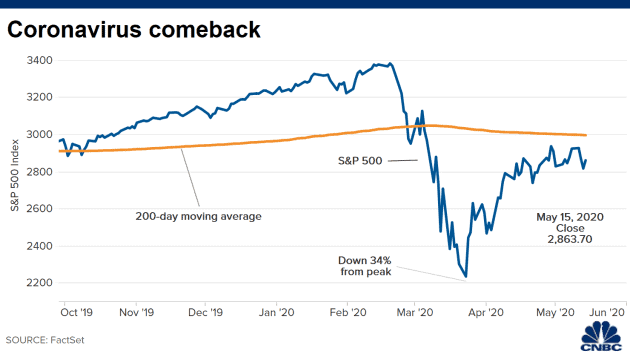
And who can blame the crowd here. The S&P 500 experienced the fastest 30% drop from a record high in history, on a literally unprecedented intentional stoppage of most global commerce. From rarely seen panic levels and profoundly extreme oversold conditions, stocks snapped back in the fastest 35% rally in more than 80 years, regaining 60% of the decline but still without much support from improving real-time economic indicators.
The market has made a head-spinning round-trip, but in other ways has gone nowhere: The S&P has been sideways in a range for about a month near levels first reached in early 2018. About half of all large stocks are down more than 30% from their high, and yet in aggregate the S&P carries its highest valuation based on forecast one-year earnings since 2002.
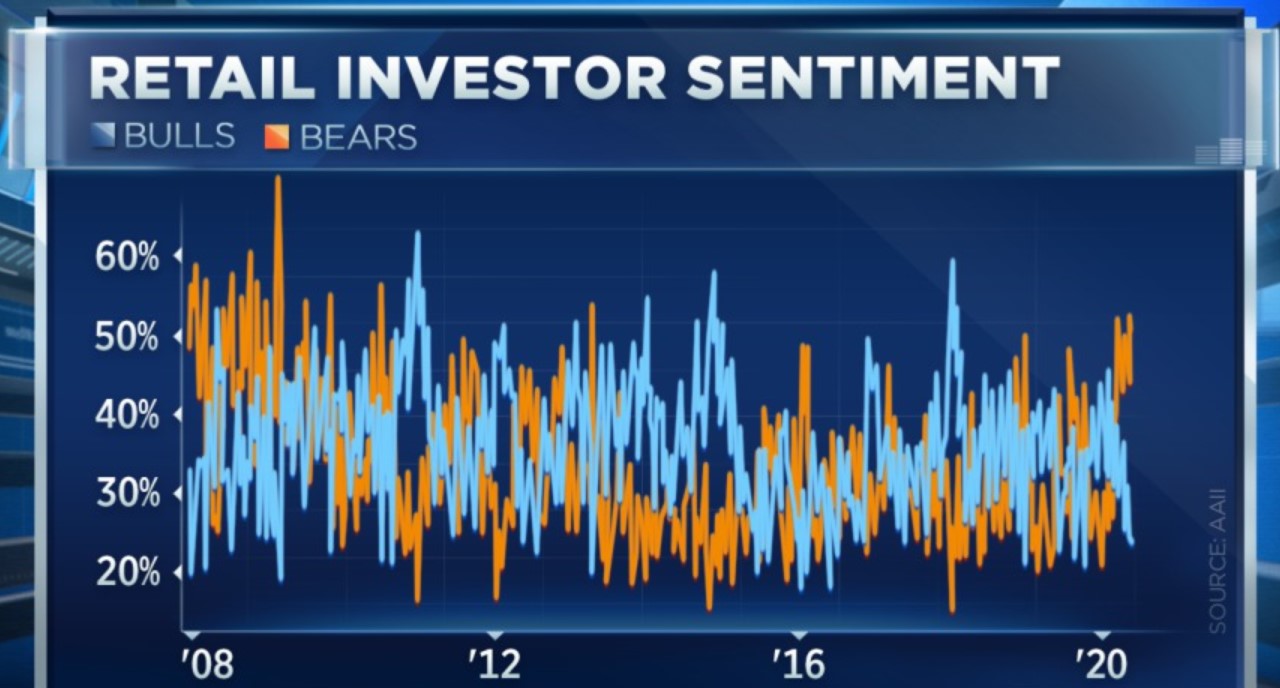
Those wishing to make a contrarian bullish case for stocks on the premise that most investors are too cautious can point to retail investor surveys and fund flows.
The weekly American Association of Individual Investors poll last week showed bearish respondents numbered more than 50%, twice those saying they were bullish on stocks over the next six months. Bears have exceeded 50% for three of the last four weeks, quite unusual, especially when the S&P is pretty distant from its lows both in price and time.

Investors pulled another $6 billion from equity funds in the latest week, according to fund tracker EPFR, taking the year-to-date net outflow to $40 billion. Meantime, an enormous $1.2 trillion has been moved out of risk assets and into money-market funds. This clearly shows longer-term public investors in a defensive posture.
But what about the pros?
Yet it’s more a mixed picture when professional investors, tactical traders and market-based behavioral indicators are pulled into the frame.
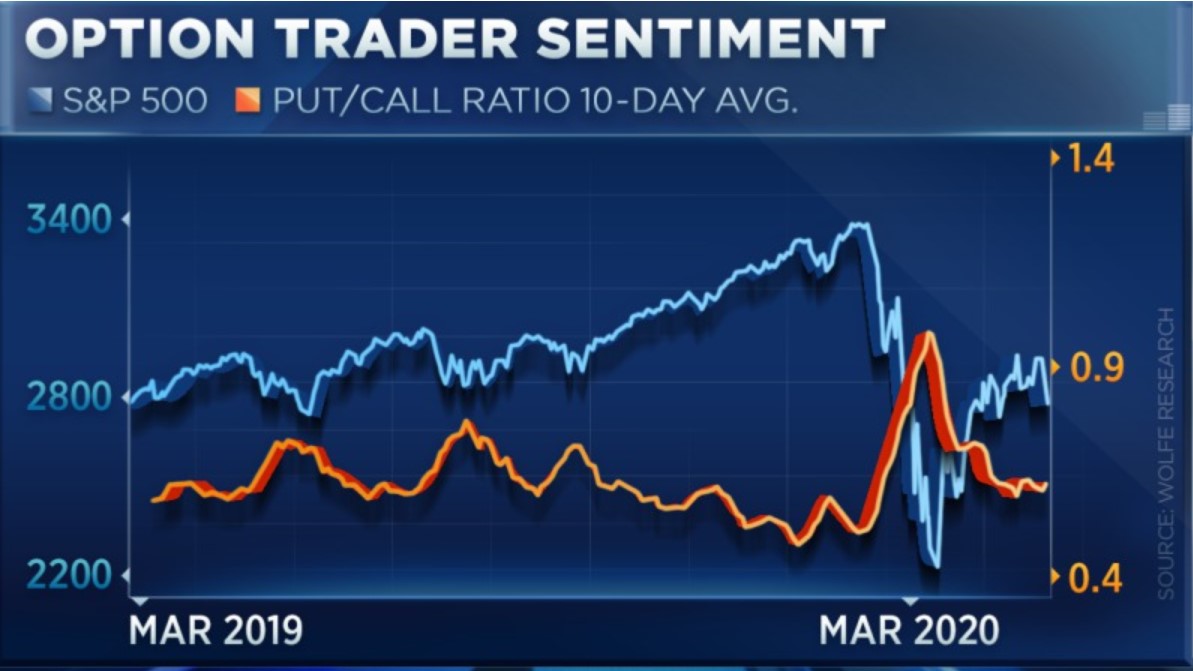
Strategists looking to make the case that the hot money has become a bit too greedy in the short term have cited a steep drop in the CBOE put/call ratio, which indicates declining demand for downside protection. While not at extreme lows – and this ratio popped higher during Thursday’s choppy market sell-off – it certainly implies traders letting their guard down.

Then there is the surge in new online-brokerage account openings among younger investors seizing on the big market drop, and those stuck at home and looking for action, described here last week. Many of the most popular stocks among clients of the beginner-focused investing app Robinhood are low-share-price name-brand stocks that have been hammered, along with speculative New Economy names such as Tesla.
An influx of less-experienced investors is more a sign of frothiness than fearfulness, of course. And David Tepper, the billionaire investor and founder of Appaloosa Management, last week on CNBC noted “pockets” of excess in the market, including special-purpose acquisition vehicles (public companies that raise cash first and then search for a business to buy). Stocks that started this way include Virgin Galactic and DraftKings.
Then there are the sentiment readings that are neutral, ambiguous or offsetting.
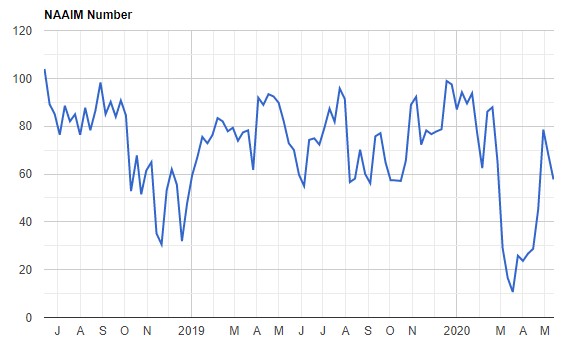
The equity-exposure of the discretionary money managers in the National Association of Active Investment Management survey is around neutral, at 57% and in fact has receded from its rebound-rally highs.
National Association of Active Investment Management survey

And the gauges constructed to capture risk appetites and investor positioning more broadly are in some disagreement.
Euphoria?
Citigroup strategist Tobias Levkovich keeps a Panic-Euphoria indicator, based on several market-activity readings, that last week bumped up against the Euphoria zone, a threshold designed to reflect a high probability that the S&P 500 will be lower in 12 months’ time.
And yet Bank of America’s Michael Hartnett keeps a weekly Bull & Bear Indicator — encompassing fund positioning, credit-market technicals, fund flows and stock-market breadth — which has remained pinned at zero, the maximum bearish level, for three weeks.
Boil it all down and it’s fair to say investors collectively are undecided on the path for stocks and the economy, in a market that’s both up a lot and beaten down, with extraordinary liquidity support from the Federal Reserve, but companies borrowing heavily simply to cover costs.
The sometimes-whippy rotation from the dominant winners (mega-cap growth, biotech, gold, Internet stocks) to depressed laggards (banks, small-caps, energy) shows the game is largely in the hands of systematic investing programs pinging between momentum tactics and mean-reversion bets.
Forced to characterize sentiment, it seems more cautious than confident. The tape itself has acted as if large investors feel under-invested in equities. Last week was the fifth time since March a two-day drop in the S&P failed to stretch a losing streak to three.
The S&P 500 may have defined a temporary peak with its inability to crack above 2950 on several recent tries, but a drop to the low-2700s or even 2650 would keep intact the notion of a sideways trading range well off the March lows.
What’s clear, though, is that anyone buttressing a positive case by claiming “Everyone’s bearish” and those calling for deep downside on the notion that “Everyone is too bullish” are equally unreliable at the moment.

