

Everyone likes a bargain. That’s a reason many investors succumb to the temptation of buying beaten down stocks. But savvy investors know that stocks on the rise tend to give better and more reliable returns. Identifying breakouts from sound chart patterns is a great way to improve your timing in buying stocks and find the biggest stock winners.
Breakout Stocks Defined
A breakout is simply when a stock’s price surpasses a prior area of resistance. That’s an area where the stock previously turned lower either once or often multiple times. Sellers come in around the same price and that causes the stock to fall after hitting those areas of resistance. Each chart pattern has an optimal buy point specific to it based on those areas of resistance. When stocks on the rise are able to “break out” above that area of resistance, it changes the prospects for the stock’s appreciation.
Just as a rocket needs a lot of power to break free from Earth’s gravity, stocks should also show power as they break out above resistance. Strong buying demand is the rocket fuel that propels breakout stocks to new heights. Trading volume is usually much higher than recent activity. That’s evidence of institutional investors’ enthusiasm. The price movement above the resistance shouldn’t be timid. It should be decisive. With price and volume in place at a stock’s breakout, not only do you improve your chances of profiting on the stock, you also tend to have higher returns.
Examples Of Stocks On The Rise
Need proof? IBD founder William O’Neil began researching breakout stocks in the late 1950s when he was starting out as a stockbroker. During more than a half century of investing, he continually compiled charts on the best stock market winners of each market cycle. He found the biggest winners often started their moves the same way, with a breakout.
And it wasn’t just the stocks he observed during his lifetime. O’Neil’s research team collected equity stock prices going all the way back to the 1890s. The results? Even more than a century ago, the biggest stock market winners showed breakouts at the beginning of their major moves. In his classic book, How to Make Money in Stocks, O’Neil details all the elements that stack the odds in your favor of finding these biggest stock market winners. For just a sampling of what these stocks on the rise look like, the 4th edition features 100 charts in the first chapter. They span more than a century of phenomenal stock moves. And they all started with breakouts.
Tip: To find today’s top stocks that may be setting up for a new breakout, regularly review IBD stock lists and check Stocks Near A Buy Zone.
You should limit how far up you chase these stocks on the rise. Buying within 5% of the optimal buy point is a sensible strategy. As stocks go beyond this range, they tend to go through normal pullbacks. Buying extended increases the likelihood that losses from a normal pullback could shake you out. The closer you are to the buy point, the easier your selling and holding decisions are.
Don’t Fear Breakaway Gaps Or Big Gains
Say you’ve been watching a stock set up in a classic chart pattern. You’ve done your homework and now you’re waiting for a stock breakout above the buy point. Then some news comes out, often a stellar earnings report, that pushes it over the buy point. Way over. A move of 10% or more at the open might make you feel like the stock left without you. These breakaway gaps often never give you the chance to buy within the 5% recommended buy range.
It might make you uncomfortable, but these stocks on the rise often deserve a purchase anyway. Something caused investors to dramatically reevaluate the company’s worth, and the optimism usually grows from there. When past the 5% buy zone because of a breakaway gap, you should try to buy as close to the open as possible.
Of course, it’s not just a pretty chart that causes a buy decision. The best way to invest money in stocks is to start with a sound company. Strong earnings and sales growth, leadership in its industry, superior return on equity, and exciting new products or services are all elements that should be in place. A strong market, institutional sponsorship, and breakouts from chart patterns help you time your purchase. Investor’s Business Daily and its website investors.com have multiple screens designed to filter the thousands of stocks trading on the U.S. market to the best stocks to invest in. The IBD 50, Sector Leaders and IPO Leaders are just a few such screens. Accompanying chart analysis makes finding the breakout stocks on the rise even easier.
Breakout Stock Example
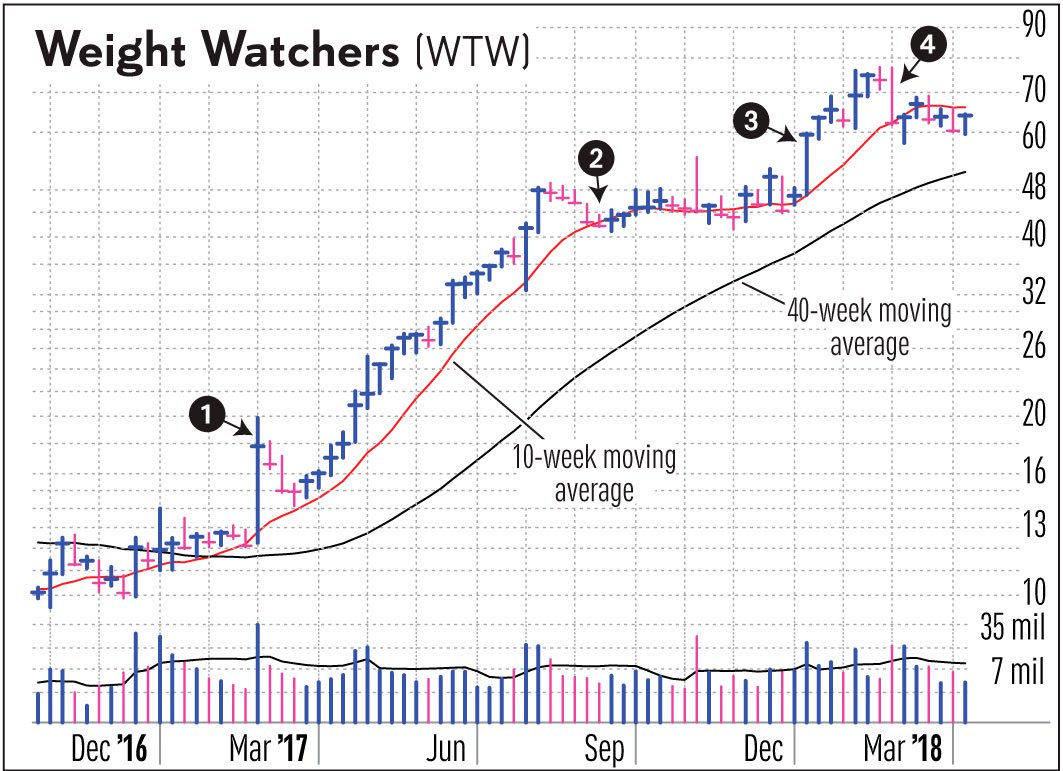
Weight Watchers International (WTW) saw an astounding 47% rise on its breakout week in March 2017 after earnings (1). While the stock pulled back, the 10-week moving average contained the move. In fact, Weight Watchers didn’t close below its 10-week line until Sept. 15 (2). Using that simple sell rule netted a 135% return in 6 months. That’s even with the original buy occurring after the 47% breakout week.
A newly created IBD Breakout Stocks Index captured this gain in Weight Watchers. The index has a history going back to Oct. 2010 and keeps a minimum of 25 names, rebalanced weekly. Once a breakout stock makes the index, it stays on until removed by a sell rule, like a close below the 10-week moving average.
Weight Watchers came back on the IBD Breakout Stocks Index four months later on another breakout (3). This time, the breakout week saw a still impressive 26% gain. Using a close below the 10-week line as a sell rule again captured a more modest 7% gain (4). Again, that occurred even with the purchase coming after the huge breakout week.
It illustrates an important point. They don’t all have to be gains of 100% or more to keep your portfolio humming. And spoiler alert: not all breakouts work. Some breakouts fail. Some just don’t go anywhere. Inevitably, you catch one of these biggest stock market winners before its huge move. When you do, the impact on your portfolio more than makes up for the ones that don’t work and can result in life-changing returns. From its inception in Oct. 2010 through Aug. 24, 2018, the compounded annual return of the IBD Breakout Stock Index is more than 30% including dividends, according to calculations by Thomson Reuters. That’s more than a 700% return in under eight years.
IBD partner Innovator Capital Management will launch a new exchange traded fund (proposed ticker: BOUT) around Sept. 12 based on the new IBD Breakout Stocks Index. You can register for a Sept. 12 Innovator webinar that will discuss the new ETF.