Bitcoin’s (BTC) historical price trends suggest a recurring pattern of strong upward momentum following Christmas, particularly during halving cycles. They highlight how Bitcoin typically enters a profit zone after each halving event, with price increases accelerating in the months following the December holiday season.
Bitcoin Price Performances Post Christmas in Halving Years
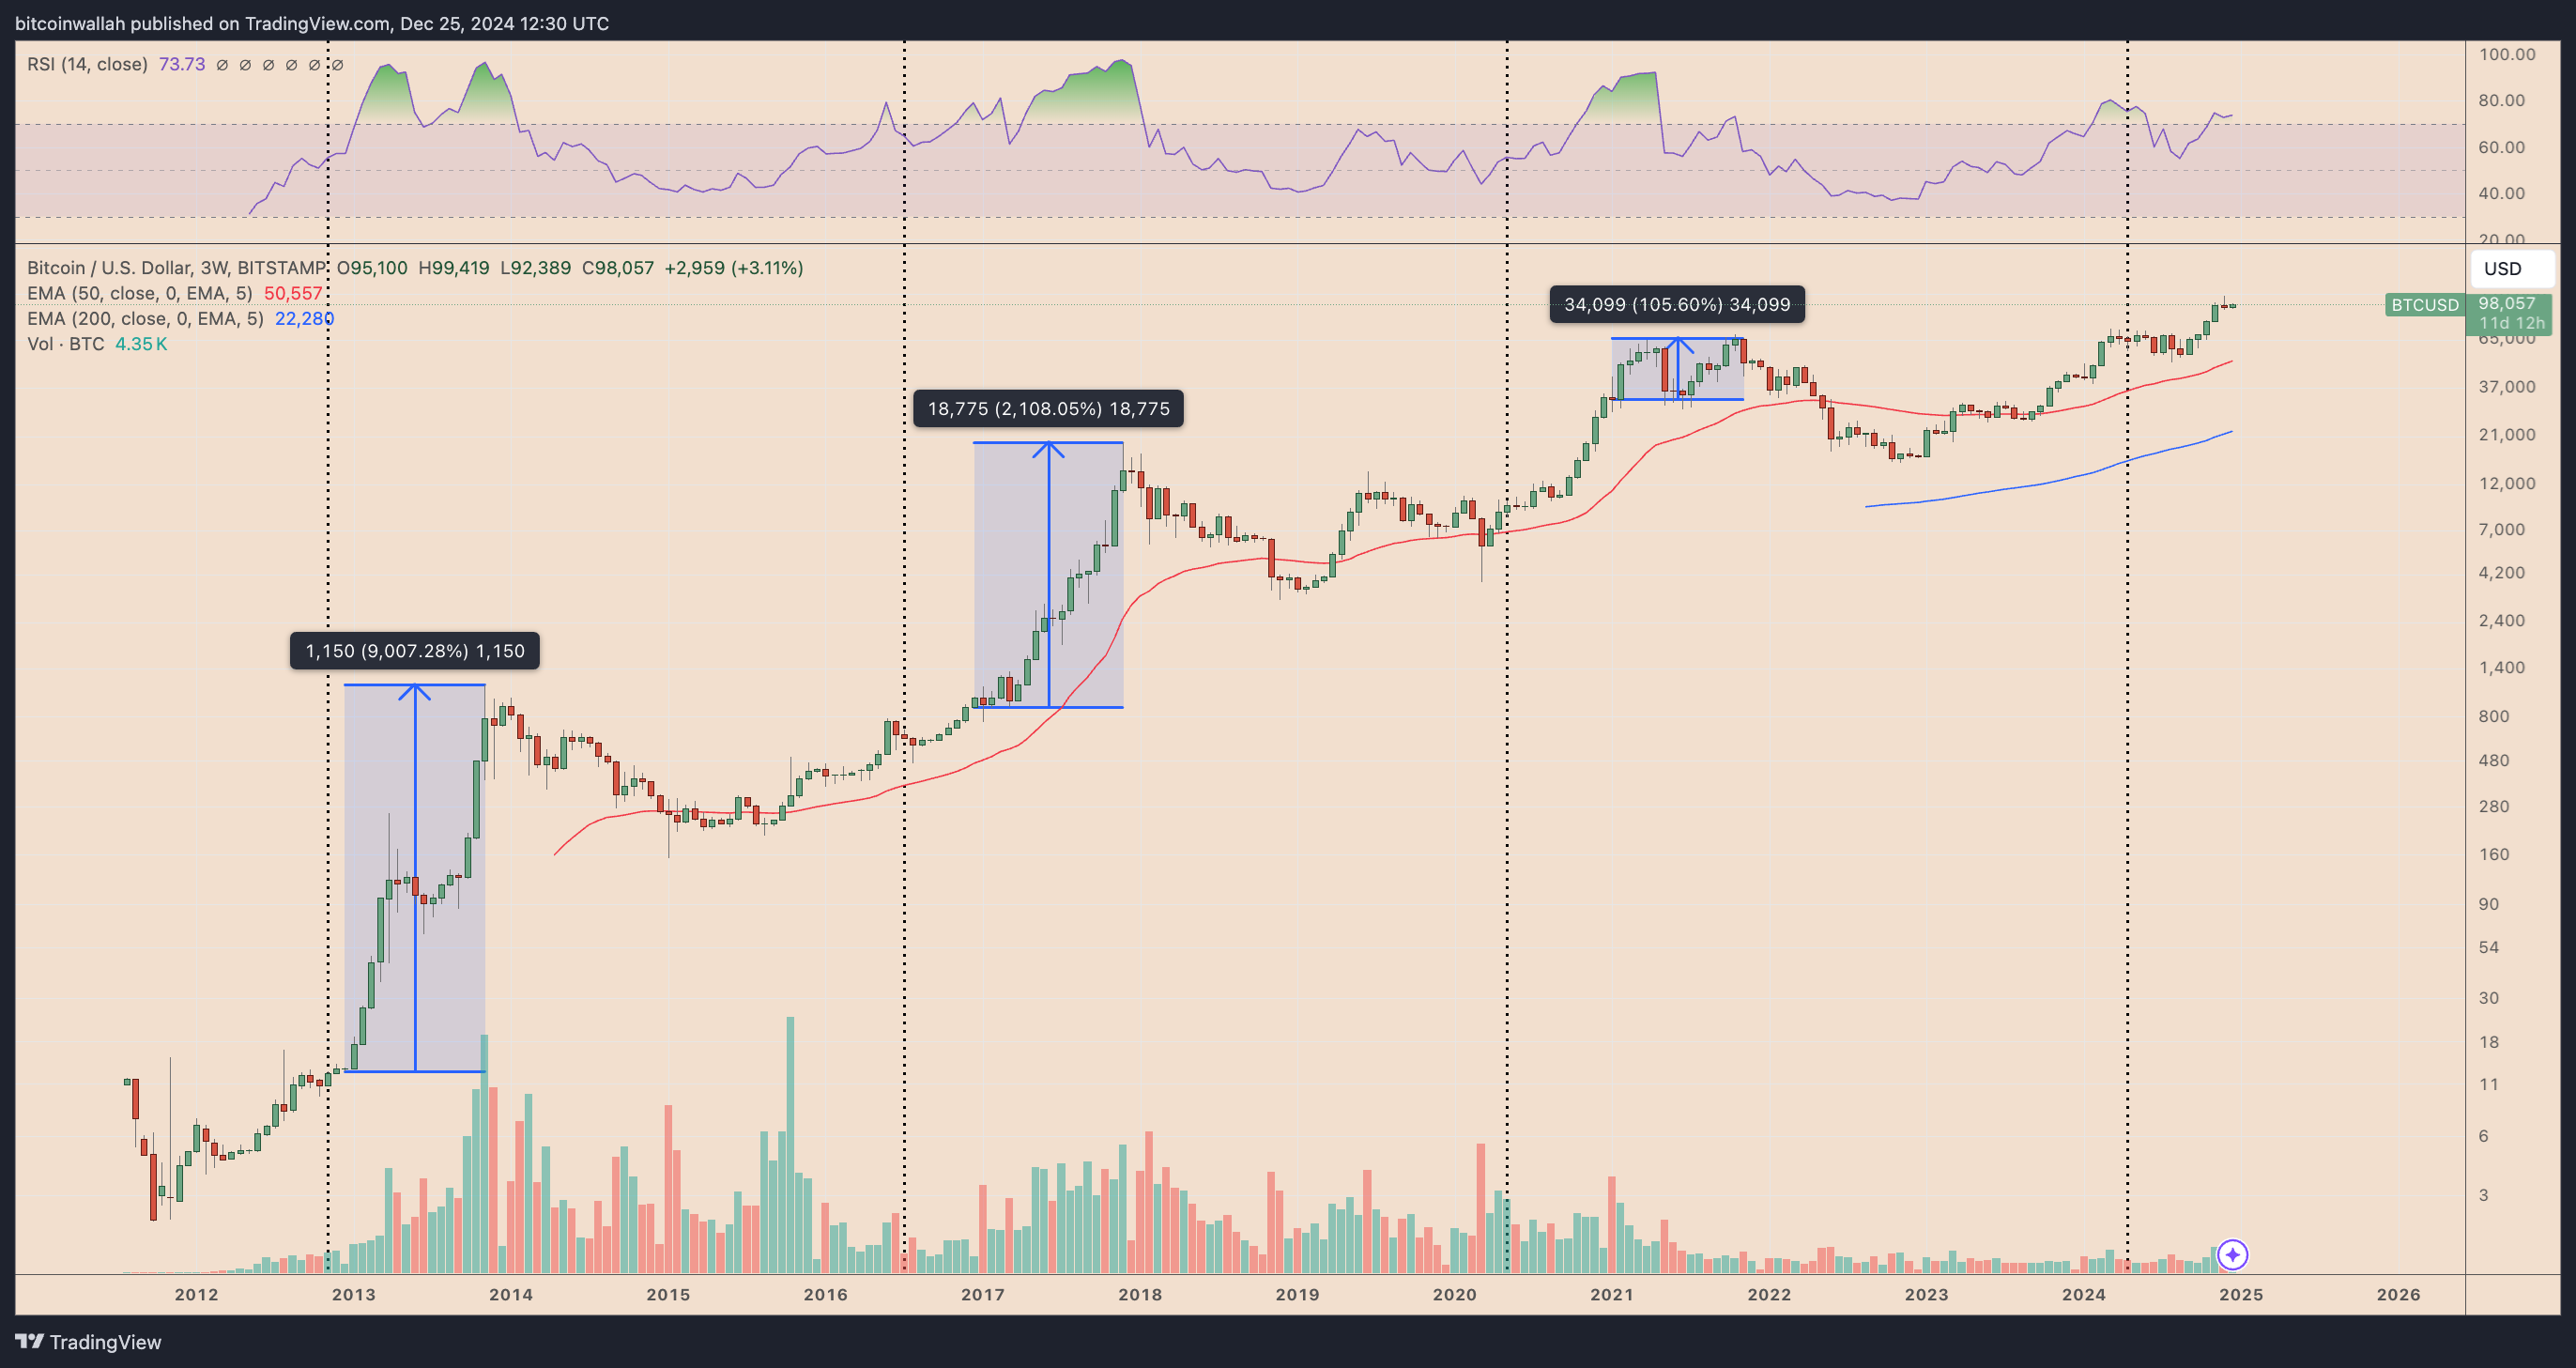
After the 2012 halving, Bitcoin saw modest consolidation before rallying over 9,000% in early 2013.
 BTC/USD three-week price chart. Source: TradingViewSimilarly, the 2016 halving was followed by a post-Christmas breakout of over 2,100%, eventually fueling the 2017 bull market. The same trend repeated after the 2020 halving, as Bitcoin surged by over 100% to its all-time high shortly after Christmas 2020.
The pattern could be tied to seasonal market dynamics. Year-end institutional balance sheet closures and renewed capital flows in January often drive speculative investments.
For the uninformed, institutional investors often adjust their portfolios at the end of the calendar year to lock in profits, manage tax liabilities, and align with investment mandates. These activities can increase market liquidity and volatility.
Additionally, retail interest tends to pick up after the holiday season, adding to the momentum. Retail investors tend to increase their market participation after the holiday season, possibly due to year-end bonuses, holiday savings, or a renewed focus on financial goals for the new year.
 Bitcoin price performance after Christmas. Source: Crypto RoverThe period between Christmas and New Year’s, often called the “Santa Claus Rally,” has historically been associated with stock market gains. This phenomenon is attributed to increased investor optimism, investment in holiday bonuses, and settlement of tax-related transactions.
As traditional markets rally seasonally during Q4 and early Q1, Bitcoin’s positioning as a non-correlated or inflation-hedge asset gains appeal. Halving cycles amplify this appeal, particularly for institutional investors looking to diversify holdings.
Bitcoin Prepares for $150,000 Record High in 2025
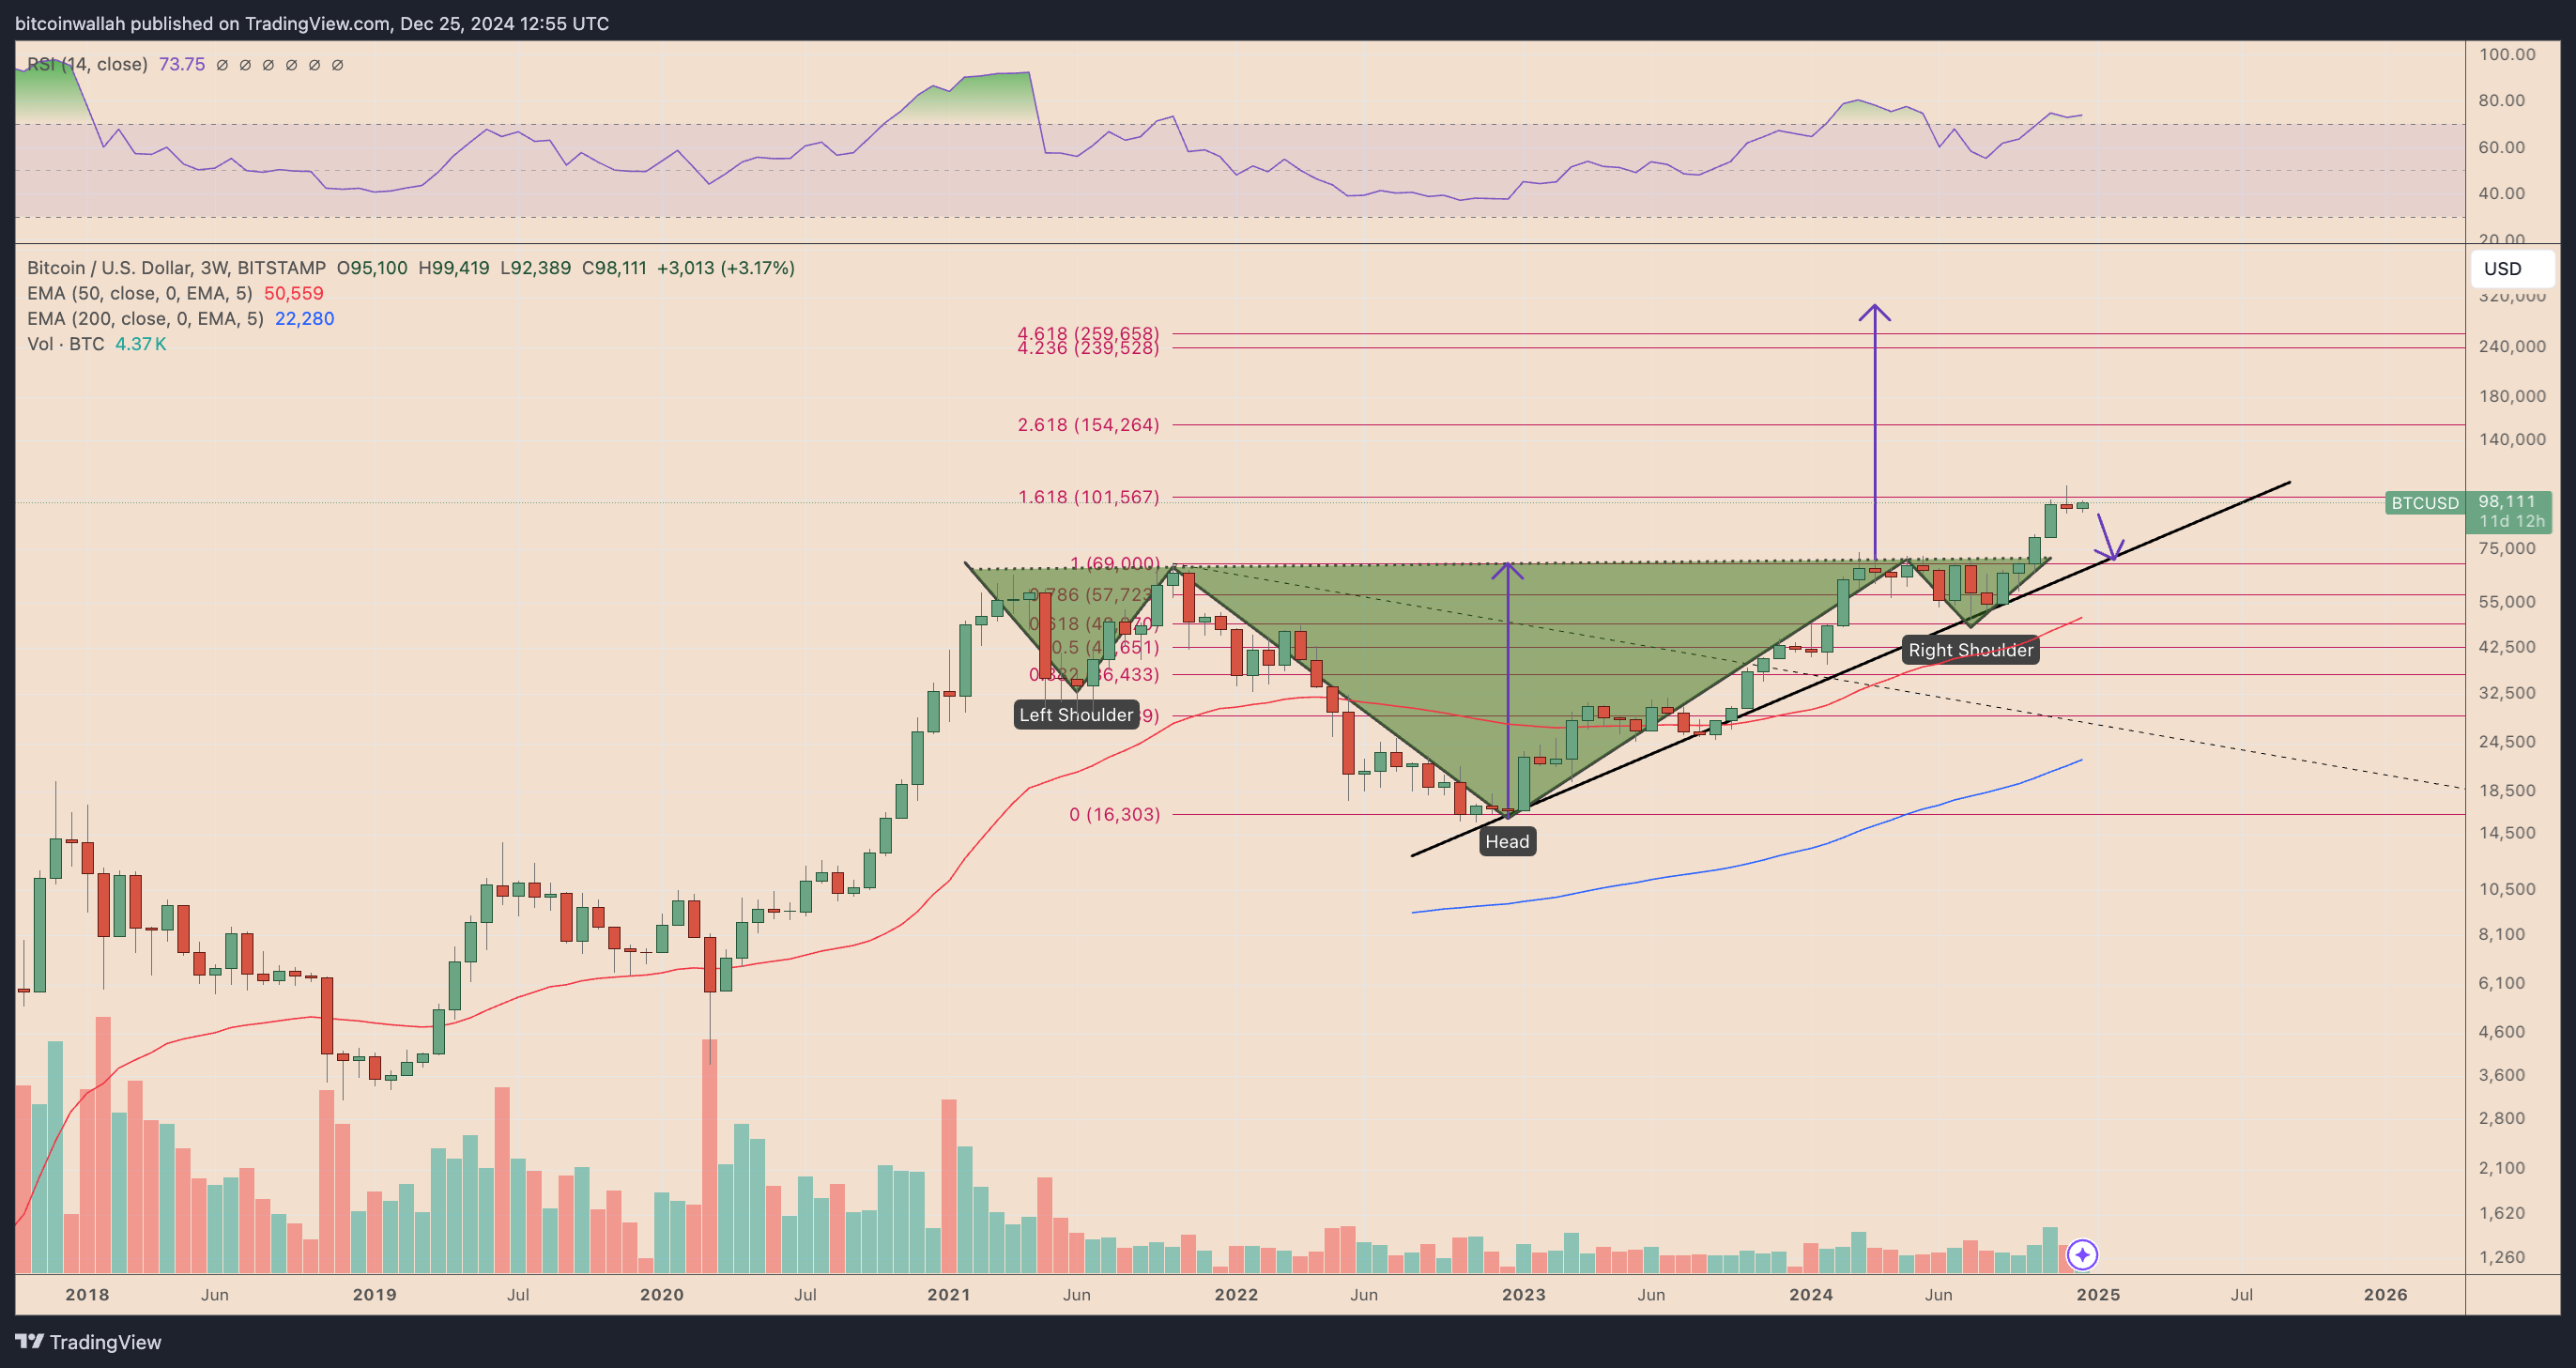
Bitcoin is testing the 1.618 Fibonacci retracement level near $101,000 as resistance, with technical indicators pointing to a potential pullback. A decline could see Bitcoin retesting support at $69,000, aligning with its ascending trendline and the neckline of the previously formed inverse head-and-shoulders (IH&S) pattern.

The $69,000 level is crucial as it served as the breakout point for the IH&S pattern earlier in 2024. A successful defense of this level could set the stage for a strong rebound, targeting the next Fibonacci level at 2.618, near $150,000.
Broadly, the IH&S pattern projects a long-term price target of over $250,000, suggesting significant upside potential if Bitcoin maintains its bullish structure. However, immediate market moves depend on the $101,000 resistance and whether buyers step in to defend $69,000 if a pullback occurs.
