Wall Street’s summer swoon likely isn’t over yet.
Several chart analysts are pointing out that while the market has dropped sharply over the past few days, it still has a long way to go before a sustainable bottom can be reached. Even with a slight rebound on Tuesday.
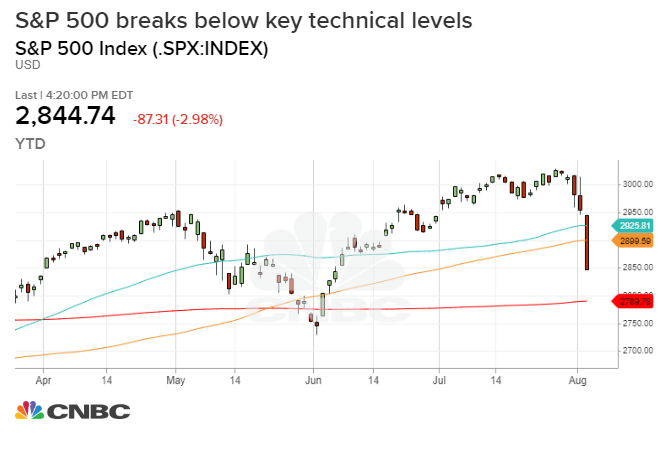
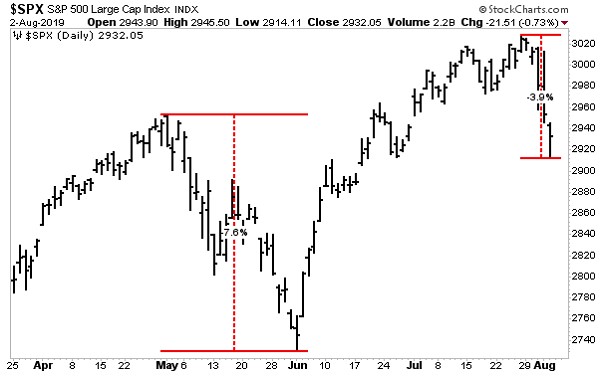
The S&P 500 has nose-dived more than 6% since reaching a record high last month as the U.S.-China trade war intensified, leading investors to dump equities in favor of safer assets like Treasurys and gold. The sharp drop pushed the broad market index through key technical support levels and dented a massive year-to-date rally in stocks.
“This is a corrective phase in an upward trend that’s not yet over,” John Roque, technical analyst at Wolfe Research, told CNBC’s “Squawk Box ” on Tuesday.
The recent wave of selling came after President Donald Trump tweeted Thursday that the U.S. will impose a 10% tariff on $300 billion worth of Chinese goods starting Sept. 1 as trade talks between the two countries struggle to progress. The targeted goods for tariffs include several consumer products, such as Apple iPhones and computers.
China retaliated by suspending the purchase of U.S. agricultural products and letting its currency, the yuan, weaken to its lowest level against the dollar in more than a decade. The S&P 500 has sliced through key technical levels like the 50-day and 100-day moving averages amid the rising tensions between the world’s largest economies.

Frank Cappelleri, executive director at Instinet, said in a note that the S&P 500′s “bullish patterns officially are voided” with these drops, noting that the S&P 500′s 200-day moving average is the level being closely watched by traders and investors.
“Since the May low, the comeback has produced a number of bullish formations,” Cappelleri told CNBC. This current sell-off “has been so sharp, what’s going to have to happen is to watch the ensuing bounce and see how strong or not it is. … It’s interesting because some of these moves are some of the largest we’ve seen all year.”

The S&P 500 — along with the Dow Jones Industrial Average and Nasdaq Composite — posted its biggest one-day drop of 2019 on Monday, plummeting nearly 3%. Last week, the broad index had its largest weekly decline of the year after Trump’s tweet and the Federal Reserve failing to signal aggressive monetary easing later this year.
But the selling is not over yet, if history is any indication.
Data compiled by Bespoke Investment Group also shows these types of minor pullbacks take some time to run their course. The firm looked at all the retreats of at least 5% during the current bull market. On average, these pullbacks last 28 days and the S&P 500 averages a decline of 8.36%.
Michael Arone, chief investment strategist at State Street Global Advisors, said individual stocks need to fall more before the market can find a bottom.
“Around 20%–30% of stocks reached a 20-day low on Friday. That needs to get to 60%–70% before we find a bottom,” he said. “So it seems like perhaps like the onset of a typical market correction. It wouldn’t surprise me as investors recalibrate their Fed and trade expectations that the market suffers a correction.”
A bounce at these levels will likely be short-lived
Stocks tried to regain some of their steep losses on Tuesday, with the S&P 500 gaining 0.5%.Investors got some relief after the People’s Bank of China set the yuan at a stronger-than-expected rate overnight against the dollar, stabilizing the currency that has become a focus of the trade war.
Tony Dwyer, chief market strategist at Canaccord Genuity, pointed out that just 26% of stocks are trading above their 50-day moving average, “indicating at least a temporary respite from selling.” However, the weekly stochastic indicator — a technical gauge of momentum in the market — is still “a good distance away from suggesting an intermediate-term low.”
Andrew Thrasher, founder of Thrasher Analytics, said that just 10.5% of S&P 500 stocks are trading above their 20-day moving average which is around the level the market rebounded from its May swoon.
But “I’m not seeing major signs of capitulation just yet. Price action is being driven by news catalysts and while the move down has been short and volatility is extended to the upside, this isn’t quite the ‘blood in the streets’ type environment like we saw at the December 2018 low.”

