After July’s gains, August could be a more challenging month for stocks and certainly a more volatile one.
Stocks were on track to close out July in positive territory, with the S&P 500 up about 3 percent for the month as of Monday.
“I think volatility is likely to pick up, because it normally does, and I think that the trade tensions are still out there and nothing was really resolved with Europe,” despite President Donald Trump’s agreement to talk and hold off on new tariffs, said Samuel Stovall, chief investment strategist at CFRA.
Stovall said historically, volatility jumps in the August of midterm election years by about 34 percent over other Augusts. Average daily moves in the S&P 500 were 0.6 percent in August, going back to 1945, but in midterm years, the daily price move jumps to 0.8 percent.
“Because of the uncertainty associated with midterm elections, it is natural to see the average daily price fluctuations get wider,” Stovall said. The S&P 500, however, does see a gain in midterm years 61 percent of the time, but midterm Augusts average a 0.8 percent decline, meaning when the market is negative it has been very negative.
Stovall said it’s not clear at the moment which way August will break, but he notes the S&P 500 is technically bullish above the support of 2,789 to 2,801. It closed at 2,802 Monday, down 16 points.
Heading into August, social media stocks have been whacked, starting with Facebook’s $120 billion wipeout on earnings last week, the biggest one-day loss ever for a single stock. The Nasdaq’s monthly gain is now 1.6 percent, just half of the S&P and well below the Dow’s 4.2 percent July gain.

“This whole underperformance of growth versus value is at an extreme. … The last three days growth has underperformed value by its widest margin since May 2009,” said Paul Hickey, founder of Bespoke. He blamed some of that on month-end positioning. “I think it’s exaggerated things. … Overall market breadth has been holding in really well, if not improving. It’s hard to call it anything but end-of-month positioning. The stocks that were doing the best up to two days ago are doing the worst, and the stocks that were the worst up to two days ago are pretty much flat.”
But heading into August, history is not on the side of a positive market, he said.
“It’s not a great month for equities,” said Hickey. He said the performance in recent years has been even worse than broader time frames. When looking at the S&P 500 in every year since 1983, August has been a weak month on average, but it’s been even weaker in the current bull market.
August has often started off with a slow and steady decline through the first 10 days of the month since 1983, before stabilizing. But during the current bull market, Bespoke found that the S&P has not stopped declining until late in the month. The S&P averaged a 1.2 percent decline in Augusts since 2009, but just a 0.23 percent going back to 1983.

Stovall said August ranks behind September in midterm election years, but June is the worst month. The worst performing August was 1998 when the S&P fell nearly 15 percent in response to news about the losses at Long Term Capital Management. The best was an 11.2 percent gain in 1982, the start of the 1980s bull market.
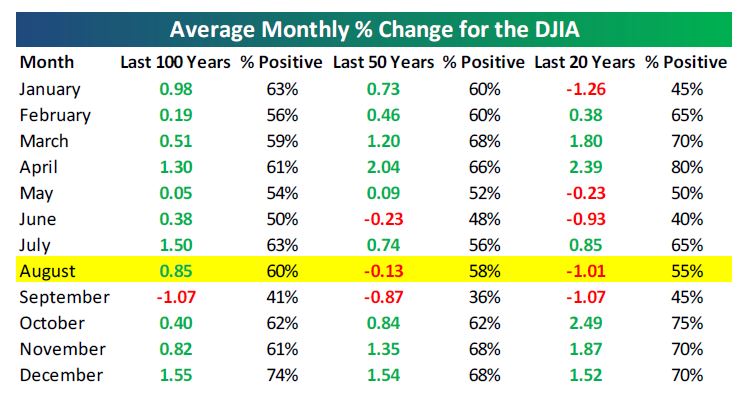
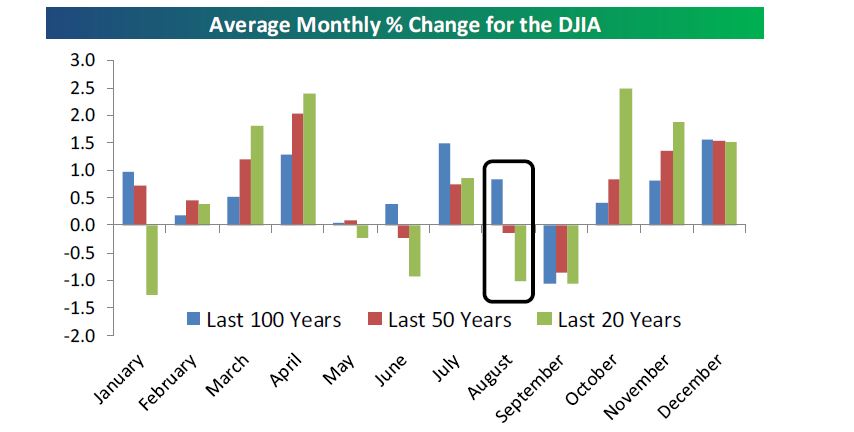
Bespoke also looked at the performance of the Dow in August, and found that over the last 100 years, it has been up 60 percent of the time with a gain of 0.9 percent, but more recently it’s been weaker. Over the past 20 years, the Dow was down just over an average 1 percent, though positive 55 percent of the time. Bespoke notes that once through August, the market will have to deal with September, the only month where it’s averaged negative returns in the last 100 years, 50 years and 20 years. The 1.1 percent decline averaged over 100 years was similar to the average decline over 20 years.

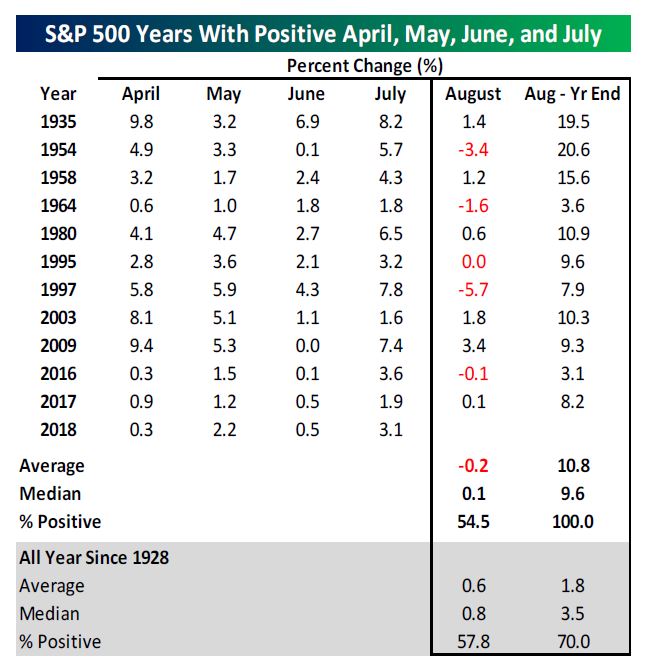
Hickey said he also looked back at years when the S&P was higher in April, May, June and July, or years where investors did not “sell in May.” There were 11 incidents since 1928.
The month of August had mixed returns after those 11 periods, with an average decline of 0.2 percent, and was positive just half the time. But the data clearly showed a positive trend with the S&P sharply higher for the balance of each year with a very strong average gain of 10.8 percent.

When looking at the performance of the market across every month, investors who survive the rockiness of August and September have been rewarded by a strong October, on average, and strong remainder of the year.


