
An underlying trend may be insulating the market from a sustainable decline.
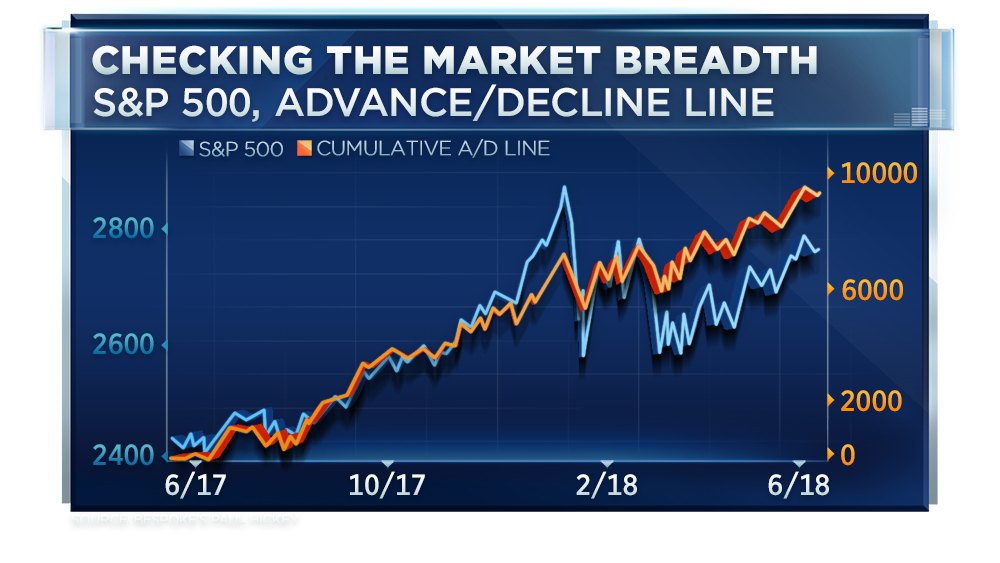
Based on charts of the S&P 500, Nasdaq and Russell 2000, the Bespoke Investment Group’s Paul Hickey used a technical indicator called the advance/decline line to show market breadth is positive — a sign that supports expectations of higher stock prices.
“What you see is that while the S&P 500 remains well off its highs from January, the cumulative A/D line has been making new high after new high. Back since the January peak in the S&P 500, there’s been 14 new highs in the S&P A/D line,” the firm’s co-founder said Wednesday on CNBC’s “Trading Nation.” “That tells us that there’s an underlying trend in the market where investors are acquiring stocks.”
According to Hickey, the same holds for the Nasdaq, which closed at an all-time high on Wednesday.
“The cumulative A/D line of the Nasdaq is providing confirmation of the new highs. So, we’re seeing price and breadth move step for step which is what we tend to like to see,” he said. “It’s confirmation of the rally.”

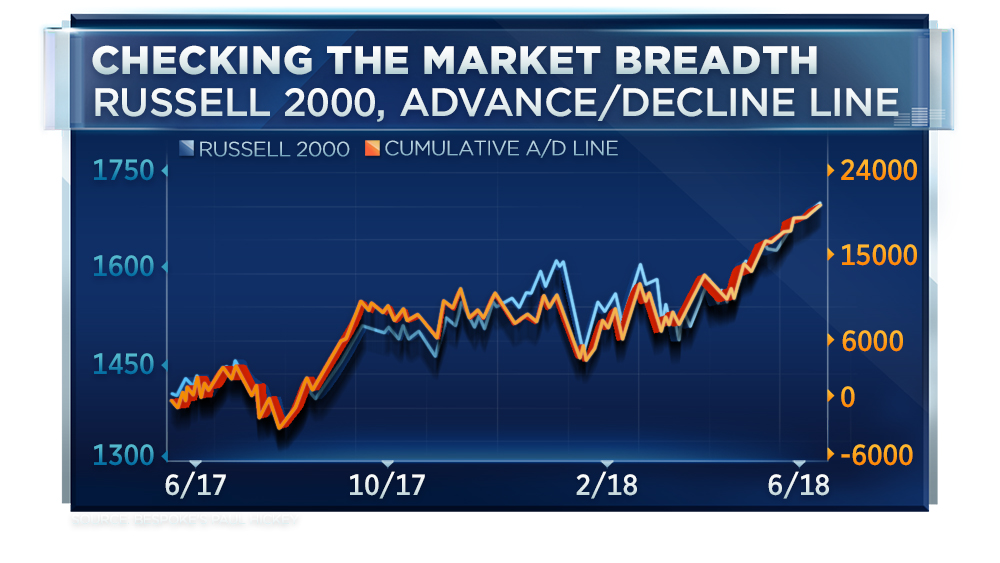
The Russell 2000 is also in an encouraging spot.
“The Russell has been making new highs, and breadth has been making new highs as well. So, again — what all three are telling us is that the rally isn’t just being driven by a few stocks,” Hickey said. “Barring any event out of nowhere, the underlying trends for the market remain pretty positive and the pros outweigh the cons.”